 Posted on November 18, 2026 by Nate_007 Reads:
Pandas Introduction - Merging
In this article we will go over the basics of merging dataframes in Pandas. Merging is a powerful tool that allows you to combine data from different sources based on common columns or indices. This is particularly useful when you have related datasets that you want to analyze together.
Merging dataframes in Pandas is similar to joining tables in SQL. You can perform different types of merges, such as inner, outer, left, and right joins. Each type of merge has its own use case depending on the data you are working with.
It is very useful for making data analysis easier and more efficient. By merging dataframes, you can create a single dataframe that contains all the relevant information you need for your analysis, esentially a database view of your data which can be used to define relationships between different datasets. This allows you to perform more complex analyses and gain deeper insights from your data.
the method used df.merge() is the most common way to merge dataframes in Pandas. It allows you to specify the columns to merge on, the type of merge to perform, and other options such as suffixes for overlapping column names.
The data used in this article was generated by AI for educational purpose, you can download the data here to follow along with the examples.
Datasets:
Customer Lookup:
https://d1mazwgil0gwq5.cloudfront.net/blog_media/blog_samples/customer_lookup.csv
Orders:
https://d1mazwgil0gwq5.cloudfront.net/blog_media/blog_samples/sample_sales_orders.csv
Product Lookup:
https://d1mazwgil0gwq5.cloudfront.net/blog_media/blog_samples/product_lookup.csv
#load  the necessary libraries
import pandas as pd
import matplotlib as plt

#set file paths
fp_orders = r'./sample_sales_orders.csv'
fp_customers = r'./customer_lookup.csv'
fp_products = r'./product_lookup.csv'
Now we have set the files paths we can explore each dataset to find common columns to merge on. We will start by loading the datasets into Pandas DataFrames and then examining their structure.
# Load the datasets into Pandas dataframes
df_orders = pd.read_csv(fp_orders)
df_customers = pd.read_csv(fp_customers)
df_products = pd.read_csv(fp_products)
# Display orders dataset
df_orders.head()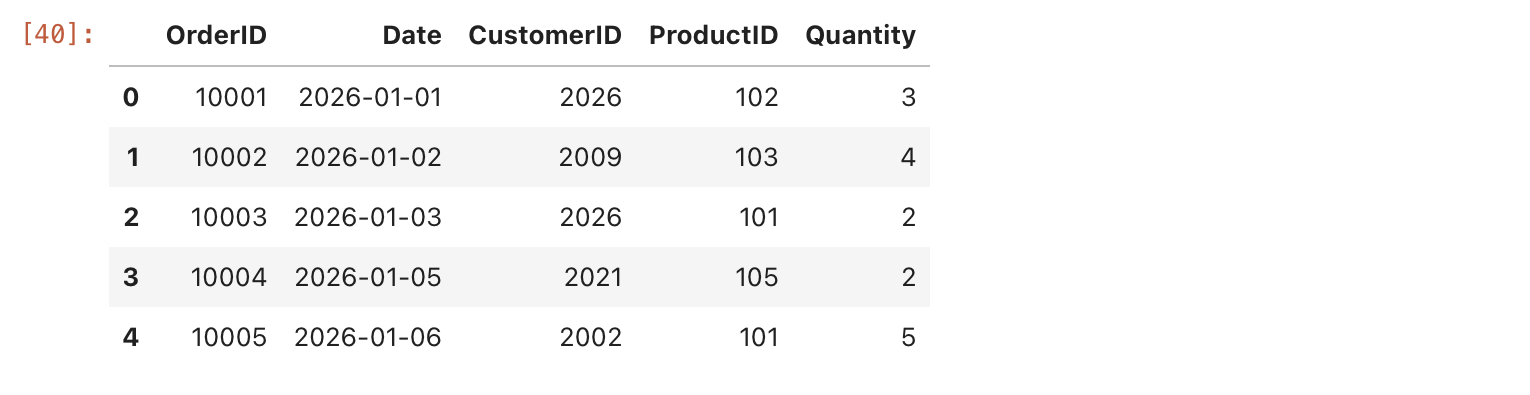
# Display customers dataset
df_customers.head() 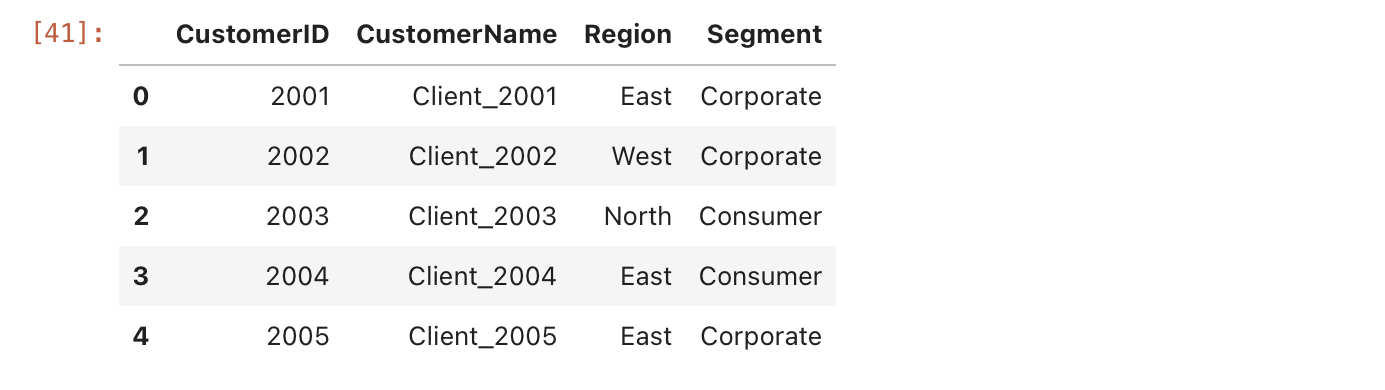
 # Display products dataset
df_products.head()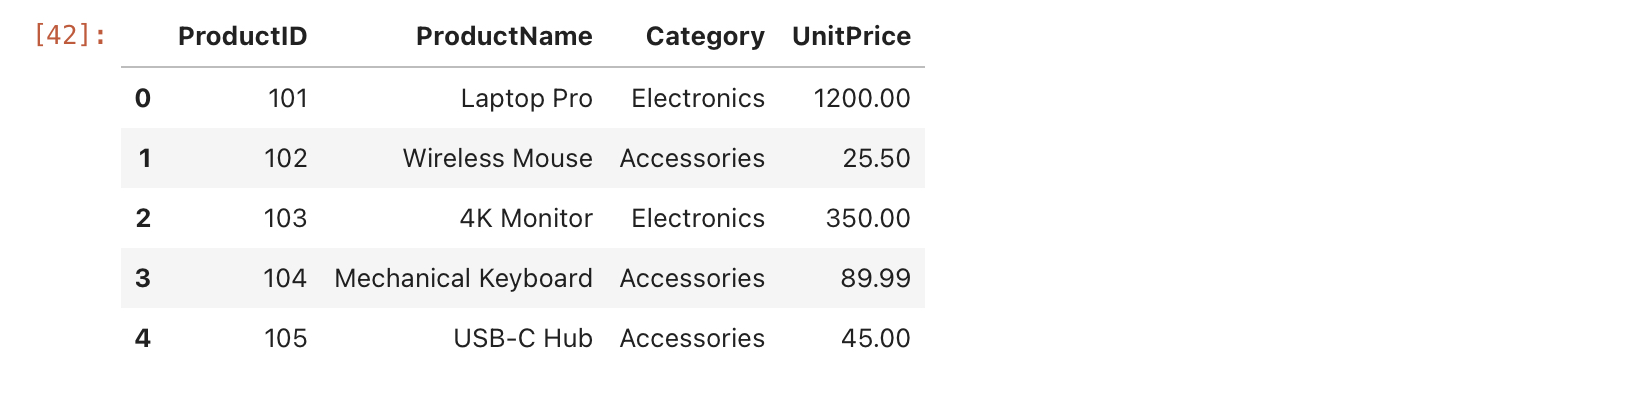
From the results above we can see that the orders dataset has a column called 'customer_id' which can be used to merge with the customers dataset, and a column called 'product_id' which can be used to merge with the products dataset.
And from these connections we can derive details like how many products does a customer buy each month, what region they comes from and what is the average price of the products they buy, what is the total revenue generated by each product, and many more insights that can be derived from merging these datasets together.
First lets investigate total revenue for each month, to get this we need to join df_orders with df_products on the 'product_id' column. This will allow us to access the product prices and calculate the total revenue for each month.
# merge df_orders with df_products on 'product_id'
df_revenue = df_orders.merge(df_products, on='ProductID', how='left')

# Display the merged dataframe
df_revenue.head()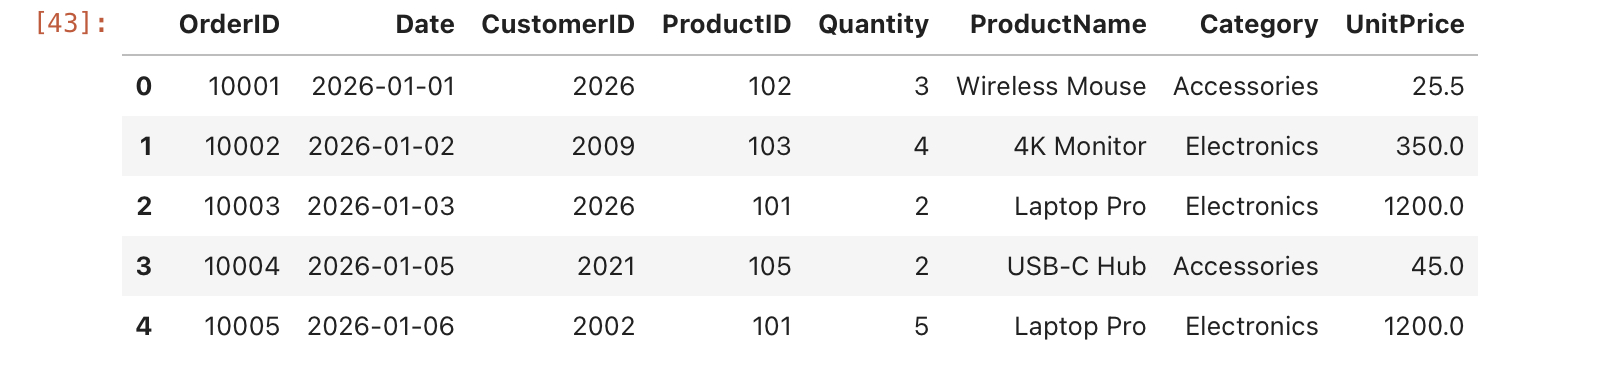
From the result we can see both dataframes have been merged successfully, and we now have access to the product prices in the df_revenue dataframe. We can now calculate the total revenue for each month by grouping the data by 'OrderDate' and summing the 'Price' column.
# First we need to convert date column to datetime format and extract the month and year from it, so we can group by month and year.
df_revenue['Date'] = pd.to_datetime(df_revenue['Date']).dt.to_period('M')

# Group the data by 'OrderDate' and sum the 'Price' column to get total revenue for each month
df_monthly_revenue = df_revenue.groupby('Date')['UnitPrice'].sum().reset_index()
#
# Display the monthly revenue dataframe
df_monthly_revenue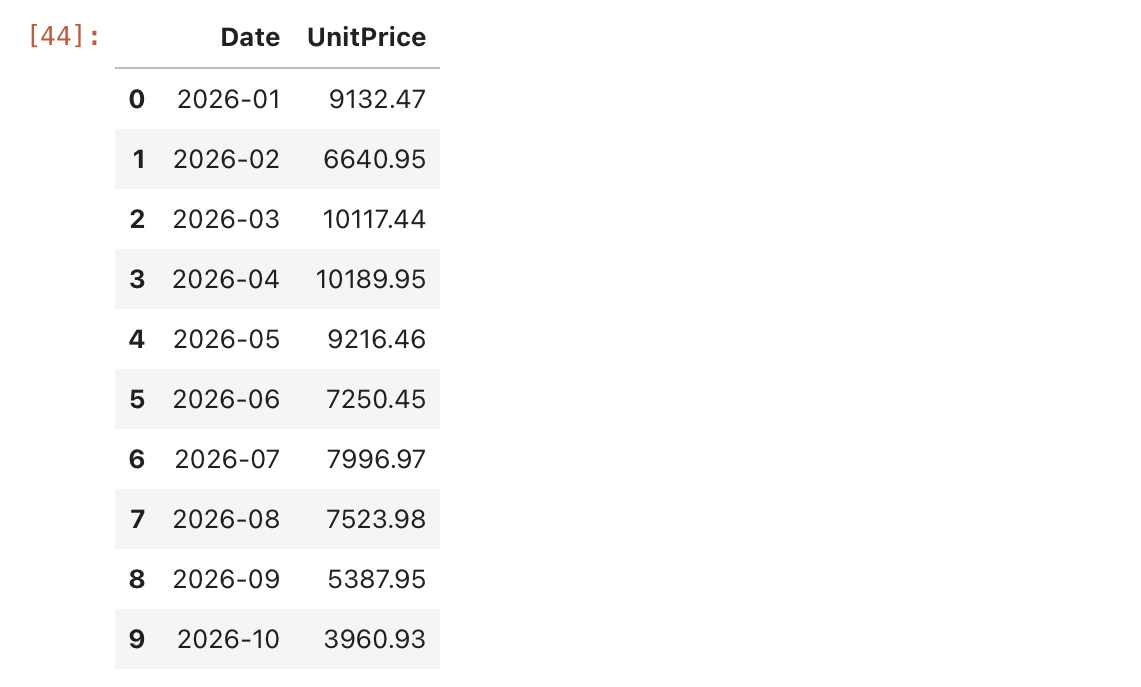
Also from the merged dataframe we can find top selling products by grouping the data by 'ProductName' and summing the 'Quantity' column. This will give us the total quantity sold for each product, allowing us to identify the top selling products.
# Group the data by 'ProductName' and sum the 'Quantity' column to get total quantity sold for each product
df_top_selling_products = df_revenue.groupby('ProductName')['Quantity'].sum().reset_index()

# Display the top selling products dataframe
df_top_selling_products.sort_values(by='Quantity', ascending=False).head(10)
Now what about if we want to know the region that sold the most products, for this we need to merge df_revenue with df_customers on the 'customer_id' column. This will allow us to access the customer regions and calculate the total quantity sold for each region.
# megre df_revenue with df_customers on 'customer_id'
df_region_sales = df_revenue.merge(df_customers, on='CustomerID', how='left')

# Display the merged dataframe
df_region_sales.head()
# Now we can group the data by 'Region' and sum the 'Quantity' column to get total quantity sold for each region. This will allow us to identify the region that sold the most products.
df_region_sales_summary = df_region_sales.groupby('Region')['Quantity'].sum().reset_index()

# Display the region sales summary dataframe
df_region_sales_summary_sorted = df_region_sales_summary.sort_values(by='Quantity', ascending=False)
df_region_sales_summary_sorted.head(10)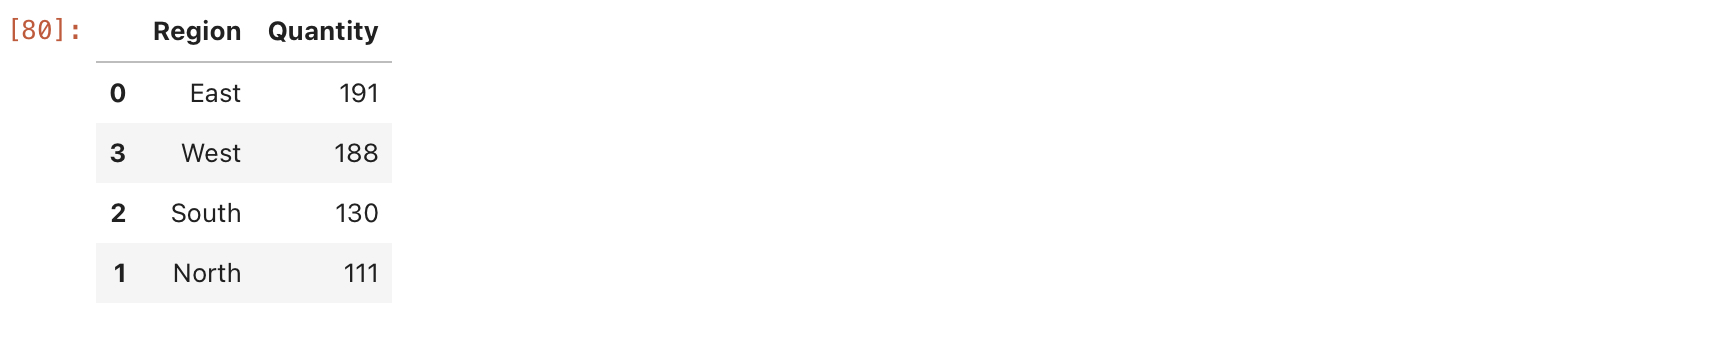
Now lets look at total revenue by region by month and plot the result using matplotlib. For this we will group the data by 'Region' and 'Date' and sum the 'Price' column to get total revenue for each region by month. Then we will plot the result using matplotlib.
# Group the data by 'Region' and 'Date' and sum the 'Price' column to get total revenue for each region by month
df_region_monthly_revenue = df_region_sales.groupby(['Region', 'Date'])['UnitPrice'].sum().reset_index()

#plot the result using matplotlib
df_region_monthly_revenue.pivot(index='Date', columns='Region', values='UnitPrice').plot(
    kind='bar', stacked=False, figsize=(10, 4),
    title='Total Revenue by Region by Month',
    xlabel='Month',
    ylabel='Revenue')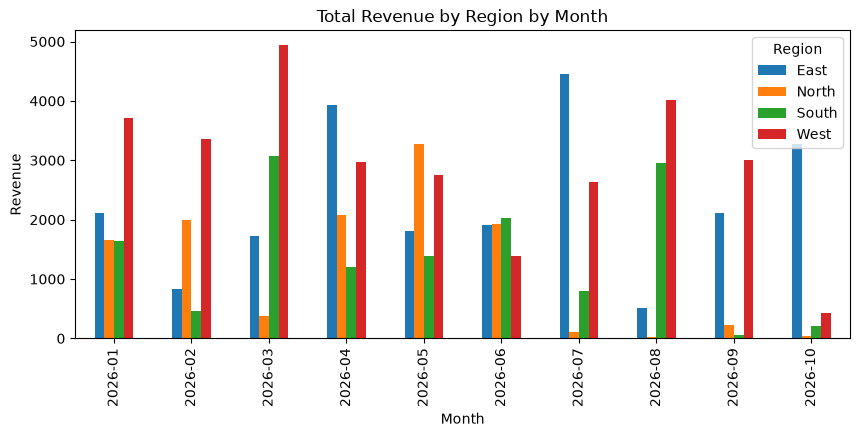
Conclusion
From expoloring the datasets and merging them together we were able to derive insights like total revenue by month, top selling products, total quantity sold by region, and total revenue by region by month. Merging dataframes in Pandas is a powerful tool that allows you to combine data from different sources based on common columns or indices. This is particularly useful when you have related datasets that you want to analyze together. By merging dataframes, you can create a single dataframe that contains all the relevant information you need for your analysis, allowing you to perform more complex analyses and gain deeper insights from your data.
This is only the tip of the iceberg when it comes to the power pandas and merging dataframes. There are many more advanced techniques and options available for merging dataframes in Pandas, such as merging on multiple columns, handling missing values, and using different types of joins. By mastering these techniques, you can become a more efficient and effective data analyst, capable of deriving insights from complex datasets with ease.